 This is why ideal elution peaks are usually described by the probability density function (1.2).y This function is characterized by a symmetrical curve (maximum for x = 0, y =03999) possessing two inflection points at x =+/ −1 (Figure 1.3), for which the ordinate value is 0.242 (being 60.6 per cent of the maximum value). The width of the curve at the inflection points is equal to 2 =1.= 235 and In chromatography, w2 1/2
represents the width of the peak at half-height w
the variance of the peak. The width of the peak ‘at the base’ is labelled w and is measured at 13.5 per cent of the height. At this position, for the Gaussian curve, w =4 by definition.
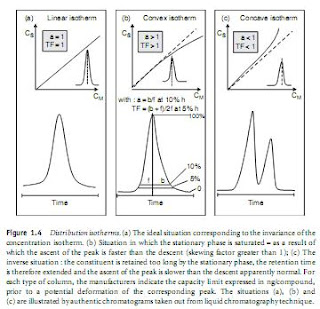
Real chromatographic peaks often deviate significantly from the Gaussian ideal aspect. There are several reasons for this. In particular, there are irregularities of concentration in the injection zone, at the head of the column. Moreover, the speed of the mobile phase is zero at the wall of the column and maximum in the centre of the column.
The observed asymmetry of a peak is measured by two parameters, the skewing factor a measured at 10 per cent of its height and the tailing factor TF measured at 5 per cent (for the definition of these terms, see Figure 1.4):

